7. MathNo. 07.12
Graph Plotter
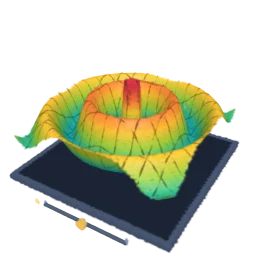
A graph turns an equation into a picture.
Handling
Tap to draw the curve. Pick a curve, or type your own, in the Splash tab.
Its tag
- Shelf
- 7. Math
- Kind
- Built from a recipe
- Your own
- Your own curve
- Sound
- Yes
- Licenses
- Own work (made in the page)
On the wall it weighs 12.0 KB: 1,009 splats, fitted to pictures of the full Splash, which opens with 520,004.
Its controls
| Control | Kind | Range | Start |
|---|---|---|---|
| Draw it | Tap | ||
| a | Slider | 0 to 100% | 50% |
| Draw | Button | ||
| Curve | List | 43 choices | Sine wave |
| b (your own curve) | Setting |
About it
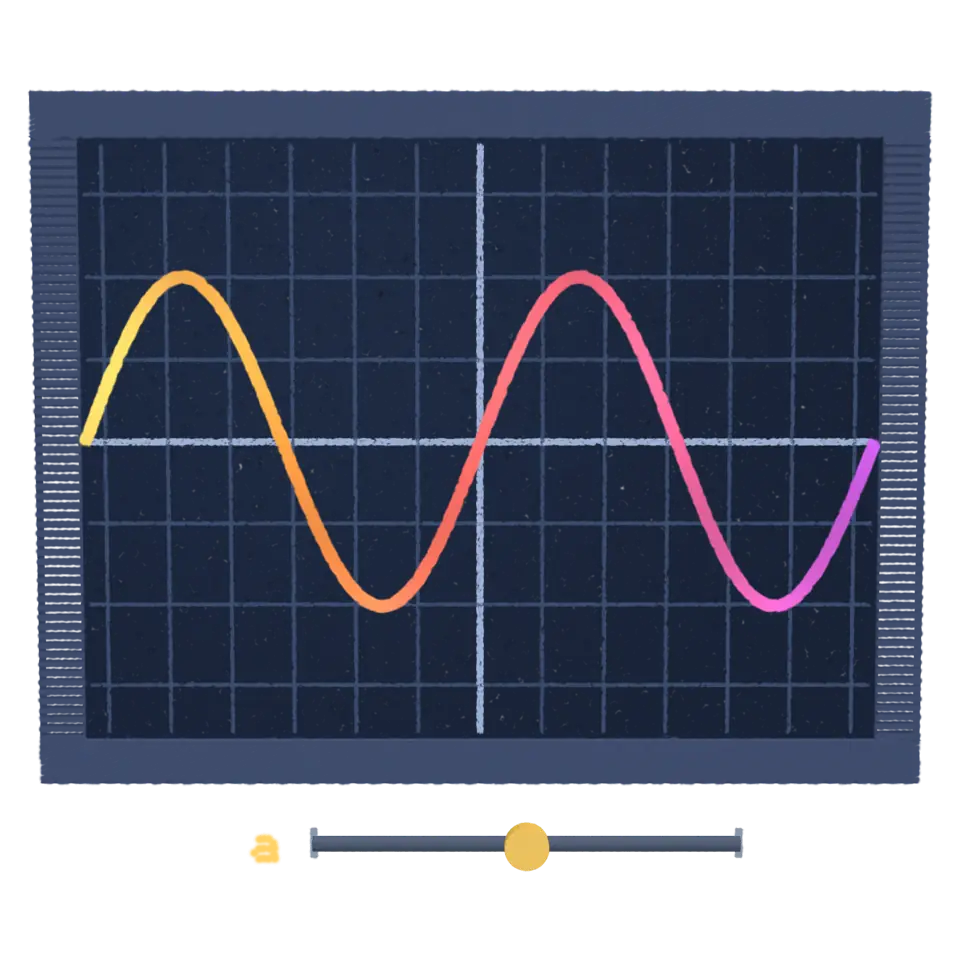
A graph turns an equation into a picture. For y = x², every x along the bottom gets a height y, and joining them draws a curve. René Descartes wrote about this kind of grid in 1637. Curves can be drawn other ways too: by distance and angle (polar), or by following a moving point over time.
Tap it and a pen draws the curve across the grid, humming a note that follows its height; then the a slider sweeps and the curve bends with it. Pick one of 42 famous curves in the Splash tab, or type your own: y = … with x, r = … with θ, or x = …, y = … with t. Put a in it to see it bend.
Details
- Splats
- Opens at 200,000 at Mid Detail, 72,000 at Low, and up to 690,000 at Max
- Your own files
- .txt
Sources and credits
Made in Splashery. Its code is MIT.